Category

Insight

Tankers International launches CII update for popular VLCC fixture app

Our Head of Research & Insight, Mette Frederiksen, takes us through the development process behind the latest update to our popular VLCC app that provides an indicative CII rating and score for every voyage fixture based on Tankers International’s world-leading VLCC market data.

The volume of data that we all work with on a daily basis, coupled with the latest regulatory updates, means that it has never been more important to ensure that information is shared to enable transparency and collaboration. Therefore, introducing indicative voyage CII scores on the Tankers International VLCC Fixture app was a clear next step to supporting charterers in understanding their CII options and assisting shipowners and managers in understanding how others are – or aren’t – achieving good ship ratings.

Since the CII regulation entered into force in January 2023, there have already been some challenges with the regulation and concerns about how transparent this data will actually be. Our latest app update aims to allow shipowners, charterers, and regulators to openly see what issues they can identify using vessel CII scores and ratings. In turn, this can help to build informed policies and help regulators understand if and where reform may be needed.

The indicative CII scores are calculated based on internal speed and consumption data from vessels that have traded in our pool and dates back to 2000. This covers more than 250 VLCCs, of different ages, designs, and constructions. Where no version of a particular VLCC has previously been entered into the Tankers International VLCC Pool, the app uses the nearest possible match based on parameters including age, build yard, and engine design.

The CII feature also includes a ‘feedback’ tab for each fixture listing so that users can report any additional information or errors. This information can only be seen by the Tankers International team, and the messages sent cannot be seen on the app. Shipowners or ship managers who believe there is an error in our calculations should use this feature to report the error, and they can choose to provide a breakdown of actual representative data for the vessel.

The Tankers International app development team will verify this data before updating the vessel’s statistics, to provide the most accurate information possible.

This, alongside other data points like market demand and fixture frequency, is used by Tankers International to create an industry-wide benchmark speed. The Tankers International benchmark has been used and honed over two decades and provides incredibly accurate indicative figures for bunker consumption.

Given the ever-changing landscape of our industry and the uncertainty that these regulations have caused, it is now more critical than ever before that industry members have access to quality data, faster to support decision making for all stakeholders. This latest CII feature will allow users to integrate even more quality data and analysis into negotiations and strategic direction.  This additional layer of insight and market transparency will benefit the entire VLCC sector.

The Year of the Rabbit brings good tidings for VLCC market

China is a key driver of the VLCC market. The sheer scale of the country’s need for oil and an infrastructure system built to accommodate large crude oil tankers means that shipping crude oil in the largest possible parcel sizes ensures economies of scale and a more cost-efficient transportation solution.

On the flip side, this also means that when the Chinese economy and the country’s demand for oil reduces, we see an immediate effect in the VLCC market. This demand slowdown was, in effect, what happened during the first half of 2022. While the smaller tanker segments benefitted from freight market shocks early in the year on the back of the conflict between Russia and Ukraine, in fact, the conflict did not directly impact the VLCC segment as this large vessel group rarely is involved in loading Russian oil.

In the early months of 2022 the VLCC market was significantly impacted by declining oil demand in China. The country was struggling with a resurgence in Covid-19 infections that caused new lockdowns and more travel restrictions. In addition, a slowdown in manufacturing activity caused industrial production decline, which reduced oil demand even further.

As a result of demand slowing and lockdowns impacting its industry, throughput in Chinese refineries collapsed to two-year lows as state-owned and integrated independent refineries ran at nearly 75% of capacity in April, while some private plants operated at just 50%, according to Platts. Intelligence from data provider Kpler shows that the reduction in refinery throughput boosted inventories in China which remained elevated through May, June and July before declining into the autumn.

This decline in refinery activity and resulting inventory build-up slowed down the country’s crude oil imports. At the same time, the price of oil was rising which did nothing to encourage more buying. As a result, we saw Chinese demand for VLCC tonnage decline. While we counted 107 monthly liftings destined for China in 2021 and a similar count in the first four months of 2022, this number dropped to an average of just 95 liftings in May, June and July.

In late summer, China began to re-emerge from its Covid restrictions. Increased industrial activity and greater freedom of movement both added to a demand surge in the second half of the year. This growth was further supported by new product export quotas that required refiners to demand increased volumes of crude oil. With oil demand improving and refinery runs increasing, we noted a significant impact on VLCC cargoes booked for discharge in China. In fact, we counted as many as 132 liftings in October, with an average of 125 monthly liftings in the final quarter of the year.

Looking back at historical data, we find an almost perfect correlation between both Chinese oil demand and VLCC liftings and refinery runs and VLCC liftings. It is, therefore, reasonable to expect this trend to continue. We can look at projections for oil demand and refinery runs in China to understand what we may expect going forward regarding VLCC activity bound for the country.

The latest estimates for China’s oil demand in 2023 peg growth levels at close to 6% on the back of the continued easing of Covid measures and economic recovery. We have seen a recent surge in infection rates in China and a temporary decline in demand. Yet, expectations are that this will be managed, and that demand will resume its growth trajectory from the second quarter. Likewise, China’s crude runs will initially be affected by the weaker demand picture, but this is also expected to reverse. We are therefore optimistic that China will continue to provide strong support to the VLCC market throughout the year.

We already count 120 global VLCC liftings destined for China in January and February, with approximately 60% emanating from the Arabian Gulf and the remaining from the Atlantic basin. While it is difficult to predict the exact number of liftings we will see in the VLCC space, the correlation theory indicates we can expect numbers to rise by around 5 cargoes per month compared to 2022 actuals. The great benefit to the VLCC market will come from the continuous pull of crude from the Atlantic basin, which comes with extra long tonne miles.

As one of the key drivers of the VLCC market, we continue to closely monitor China and the country’s energy data. The current outlook is positive with an economy in recovery mode, rising oil demand and a refining industry that is forecast to remain strong. The current crude trade flow mix into the country already supports a healthy VLCC market, and we look forward to a year of continuous growth from the economic powerhouse that is China.

2022 in review: the year of the VLCC market recovery

Now that we have closed the books on 2022, we are looking back at a year of ups and downs. The year began with high expectations of a long-awaited VLCC market recovery, and although the recovery was slow to kick off in the VLCC space, the year ended on a high. 2022 also brought added complexity to VLCC trading strategies, as a result of changing trade patterns and new regulatory requirements around the Carbon Intensity Indicator reporting.

We used our detailed VLCC fixture database to digest last year’s events and analyse how they helped to reignite the freight market for the largest tanker segment.

Join us as we review our internal cargo count dashboard.


First, we need to look at absolute growth in VLCC cargo numbers. Counting cargoes fixed in the spot market, we noted an average increase of 41 liftings per month in 2022 compared to the previous year – this represents a growth level of 19%! To provide greater context, this compares to an annual growth rate of circa 4% across the last 10 years, before the pandemic impacted the market. We saw a huge drop in oil movements during 2020 as Covid restrictions kept global mobility and productivity at a minimum. While we experienced some recovery in 2021, it was not until 2022 that the world truly began practicing “living with Covid”, and the effects of this are now mirrored in oil demand and thus tanker markets.  The year’s significant rise in VLCC cargo numbers resulted in a higher demand for VLCCs, as measured by days employed, which increased by 7%. This is in line with the 10-year average, excluding the two years impacted by Covid.

If we consider the various trade routes and how they have changed through the year, it becomes evident that significant growth was driven by the Arabian Gulf (AG) market. This load region saw an additional 35 monthly liftings across the year. This development runs parallel to the OPEC+ commitment to gradually add oil supply back to the market throughout the year. Following the announcement that the alliance would cease gradual additions, we noted a slight drop in cargo numbers from 186 monthly liftings in 3Q-2022 to 174 monthly liftings in the fourth quarter. This level of activity remains much higher than pre-Covid cargo counts of 160 in the fourth quarter of 2019, and it provides a solid baseline of activity for the VLCC market.

The second largest trade route in the VLCC market is West to East. This route encompasses all of the load regions in the Atlantic basin, excluding West Africa. Our fixture data indicates a monthly average of 38 liftings on this route – a slight decline from the previous year. This relatively low average, however, is marred by very low activity in the second quarter when we counted just 32 liftings per month. The driving force behind this was mainly at the receiving end, as China experienced a period of significantly reduced crude purchases.

Contrary to most other countries, China continued its zero-Covid policy through much of 2022 and lockdowns remained in place for longer than the rest of the world. China began to emerge from these restrictions over the summer months, and in combination with new product export quotas, the market saw renewed crude demand from Chinese refiners. This was the real catalyst for the buoyant VLCC market we have today. Not only did Chinese crude demand return, but China was sourcing much of the incremental barrels from the Atlantic basin. Tankers international recorded 46 liftings on the West to East trade lane each month in September, October and November.

The corresponding change in vessel demand on the West to East route indicates an overall decline. This is due to a more efficiently traded VLCC fleet, as more AG to West volumes emerged. VLCC owners were able to increasingly triangulate their trading between the AG, Europe and the Far East, reducing their overall ballast leg and, consequently the time that vessels are employed on the West to East route. The increase in vessel demand on the AG/West routes makes up for most of the decline on the West to East route.

Another game changer in 2022 was the resurgence of inter-Atlantic trading on VLCCs. On our dashboard these trades are listed as “West/West”. Europe has been pulling crude oil from new suppliers in the US, Brazil and West Africa, and on some of these routes, it became more economical to employ tankers from the largest segment. Since May, we count an average of 11 monthly liftings on these routes. The pull of VLCCs into Europe both from the Atlantic basin and the AG has given shipowners the ability to become more creative in the trading of their vessels, devising increasingly complex strategies to maximise the utilisation of their assets. This has been a welcome development!

Although the VLCC market was slower to recover than the Suezmax and Aframax markets and remained lacklustre through most of the first half, it has since returned with full force. It has been encouraging to see the market quickly adapting to added trading complexities and changing trade flows. We will continue to count cargoes and analyse any changes to trade flows through 2023. While we may not see the same uptick in absolute fixture numbers this year, tonne miles are set to continue on an upward trend with more oil moving long-haul. Given that development, we will see demand growth in the VLCC segment remain robust.

The thrill of Brazil – how record-breaking exports from the South American giant are boosting the VLCC market

Brazil Exports Tankers International November 2022

As the VLCC market goes from strength to strength, we’re exploring some of the factors that are driving this trend.

Oil demand across the world remains robust and is closing in on pre-Covid levels. At the same time, production levels are improving, and while OPEC and its allies have recently announced a small reduction in their quotas, alternative producers are posting record high production and exports that are resulting in fairly balanced oil markets. Brazil is one of those producers.

Firstly, on the demand side, a fresh round of product export quotas has recently been released by the Chinese government. This, combined with fewer Covid-related restrictions, has sent the country’s demand for crude surging. Refineries are taking in more crude to utilise the new export quotas and VLCC shipments into China have increased as a result.

The strong recovery in VLCC rates towards the Far East in the past month is driven both by this increase in Chinese demand but also by where in the world China is sourcing its crude supplies. Oil price spreads have supported the buying of Atlantic Basin crudes over Middle Eastern crudes, and we have seen a significant increase in West to East movements in the VLCC segment over the past couple of months. Many analysts talk about the US Gulf and how the release of Strategic Reserve barrels has driven the VLCC market, and this is not untrue. However, in addition to this, we have seen a great support from Brazil.

Crude exports from Brazil have risen to new highs amid the strong flows to China, and China remains the biggest buyer of Brazilian seaborne crude. During the months of September and October, data from Kpler indicates that oil tankers loaded 1.7 million barrels per day of crude in Brazil – an increase of 23% compared to the average exports during the first eight months of 2022. Flows to China comprise about 30% of the barrels exported via ship.

Translating this development into VLCC demand presents an equally impressive increase. In October, our Tankers International proprietary data counted a record 19 VLCCs loading in Brazil. This is a huge jump from a monthly tally of 10 VLCC loadings from January to August. With two thirds of these VLCC shipments destined for China, this drives a drastic increase in tonne mile demand for the segment. An average round voyage from Brazil to China takes 100 days to perform, employing a VLCC for significantly longer than the same cargo from the Middle East to China, which takes around 60 days on a round voyage basis (from load to discharge and back to the load region.)  So far in November, we count 15 VLCCs booked to load crude in Brazil and the month has only just started.

As oil supplies are tightening in other parts of the world, this increase in Brazilian output and exports is a key driver of the currently buoyant VLCC market.

The VLCC market renaissance: Strengthening fundamentals are driving 2022’s long-promised VLCC recovery

The year 2022 was from the outset seen by many as the year we would finally see the VLCC market recover. After two years marred by Covid restrictions and challenging oil demand, this year started with greater freedom of movement for people across the world and OPEC committing to continuous oil supply increases. As the summer draws to an end, we have a clearer picture of how these changes have directly impacted the VLCC market through the first half of this year.

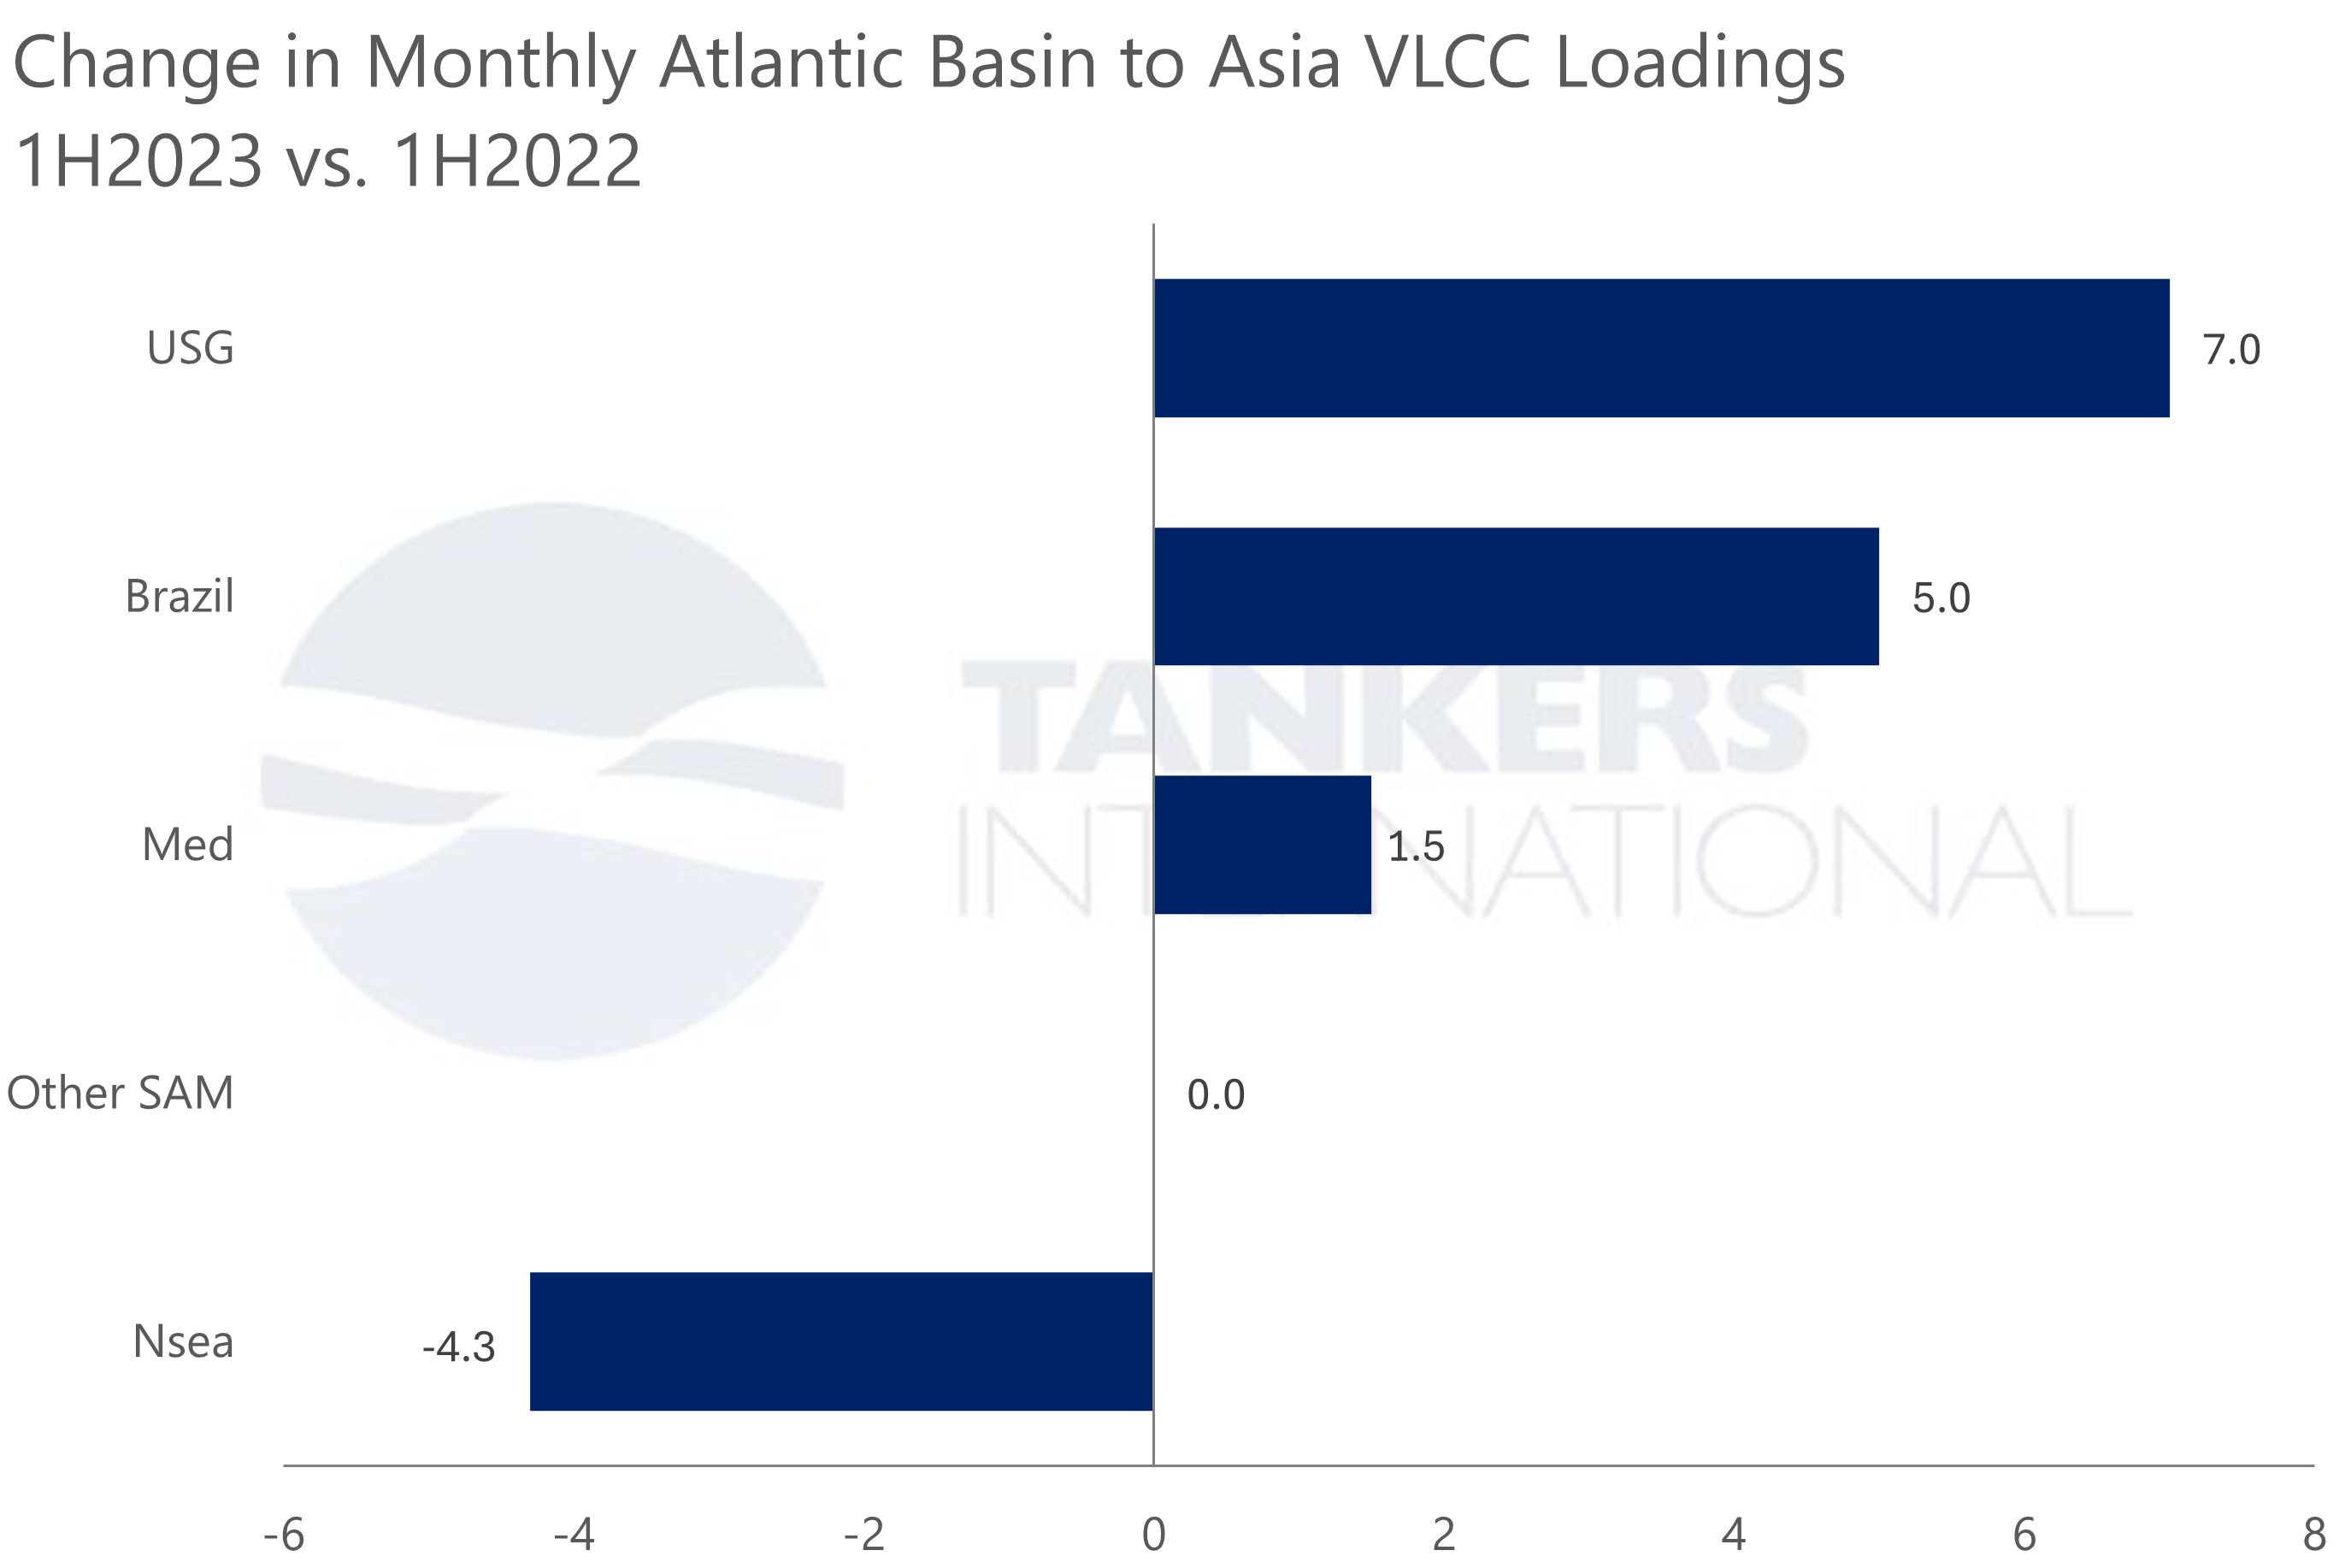
Looking at our proprietary data, we can compare the average monthly VLCC lifting numbers in the spot market for 2021 and the first half of this year. As oil demand and production have been rising throughout that period, we expect an increase in demand for VLCC tonnage and therefore, an increase in cargo counts in the segment. The data shows a definite boost. Globally we count an additional 27 monthly liftings in the VLCC spot market in the first half of this year compared to the 2021 annual average, and we are very close to reaching pre-Covid fixing volumes.

It is interesting to look at where these changes have occurred in more granularity. Unsurprisingly, the load area with the highest increase in volume has been the Arabian Gulf (AG). Many of the OPEC members that initially responded to the Covid-induced collapse in oil demand by cutting supplies are based in this region. This is also the region now returning oil supplies to the market at a steady pace. We count an additional 26 liftings per month from the Arabian Gulf alone this year. The data also shows a slight increase in volumes loading in the US Gulf with an additional four liftings per month. Much of this has been replacement barrels for Russian oil and has found a home in Europe, a route traditionally covered by smaller tanker segments when traded in lesser volumes. Simultaneously, we see a reduction in cargoes lifted from Europe over the period, as the region has kept supplies internal.

At the same time, Europe is topping the chart of increases in cargo volumes received into an area. This is off the back of a reduction in Russian oil taken following the country’s conflict with Ukraine. Traditionally Europe has not been a big receiver of crude oil in VLCC parcel sizes. However, this year has seen firstly a rise in oil imports into Europe and secondly a freight market that made the VLCC segment competitive relative to the suezmax freight market. We have also seen increased volumes into India, Singapore and other traditional receivers east of Suez. While China remains a significant taker of VLCC cargoes, the data shows an average of 5 cargoes per month fewer this year compared to 2021. This is down to them receiving more crude from Russia via pipeline and smaller tankers and due the country drawing down on inventories during a time of elevated oil prices.

It has been an interesting first half of 2022 in the VLCC market. Our previous blog discussed the change in crude flows into Europe, titled, “Atlantic crude flows drive change in VLCC tradelanes”, however, a positive takeaway from this piece, is that overall cargo counts are up, and not by an insignificant amount. 27 additional cargoes per month would employ more than 30 VLCCs full time if they were all traded between the AG and Singapore. Of course, some travel shorter distances and some travel further, but it is an indication that the market has seen the positive shift we expected at the start of the year, at least in terms of fundamentals. We need this to translate into a more dynamic freight market where tighter fundamentals dictate a sustained uplift in the freight market and a more profitable freight environment for shipowners.

Will Zero VLCC Contracting Lead to Fleet Contraction?

For the past 12 months, we have seen zero new orders for VLCC newbuildings. This has left the orderbook at historically low levels and market fundamentals are pointing to several years of record low fleet growth – or even fleet contraction.

The last recorded order for new VLCC tonnage in the Tankers International Database is dated June 2021. This is more than 12 months ago and this is the result of depressed freight markets combined with booming returns in competing shipping segments. While tanker owners have been struggling with marginal profits since Covid-19 devastated the global demand for oil, shipowners in other segments have experienced golden years, earning healthy returns and leaving them with an appetite for contracting more tonnage. Shipyards have been quick to reach capacity building vessels such as bulk carriers and container ships, and we are currently looking at a delivery timeframe of 2025 or even 2026 to build a large vessel of VLCC dimensions. At the same time, limited yard availability has allowed shipbuilders to push prices up to $120 million to build a new VLCC, and the market has not experienced price levels like this since the tanker ordering boom in 2008.

Therefore, we have a clear view of any new tonnage that will join the VLCC fleet over the medium term. Compared to historical data, the numbers are very low. By our estimation, we expect a further 20 new VLCCs to join the fleet this year, followed by another 15-20 during the whole of 2023. And that is it. No VLCC deliveries are scheduled beyond 2023.

On the flip side, the VLCC fleet is ageing, and there is scope for a significant removal programme. 20% of the current fleet is aged 15 years and older, with 10% of vessels falling into the 18+ years age category. Even if a fraction of this pool of ships is sold for removal, we will see the VLCC fleet reducing in size over the coming years. For comparison, over the last 20 years, an average of 4% of the VLCC fleet has been removed per year. A fleet contraction will be welcomed by tankers owners in a market that has been dominated by tonnage overcapacity for a number of years.

While tanker demand is rising, as Covid-constricted oil demand is in recovery mode, there is still a way to go before there is total balance in the VLCC market. A reduction in fleet supply would get us to a fundamental equilibrium between demand and supply just a little bit quicker.

Atlantic Crude Flows Drive Change in VLCC Tradelanes

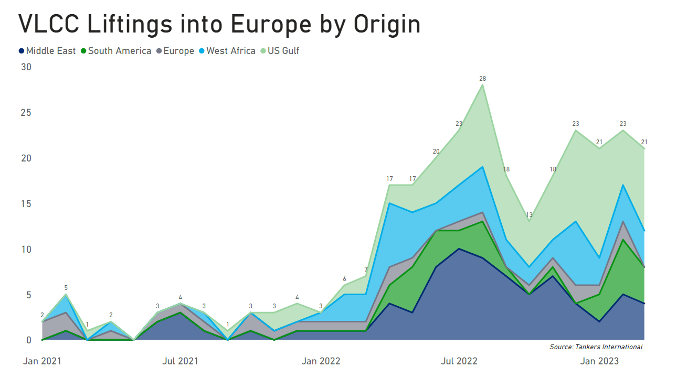
The Atlantic basin has not traditionally been a place where VLCCs pick up crude cargoes destined for Europe. These relatively short haul routes load in North and South America, West Africa and the Mediterranean for discharge in Northern Europe and are usually serviced by smaller oil tankers. This year we have seen VLCCs increasingly competing for this business resulting in a change to trade patterns for the segment. There are a number of factors that help to explain this situation.

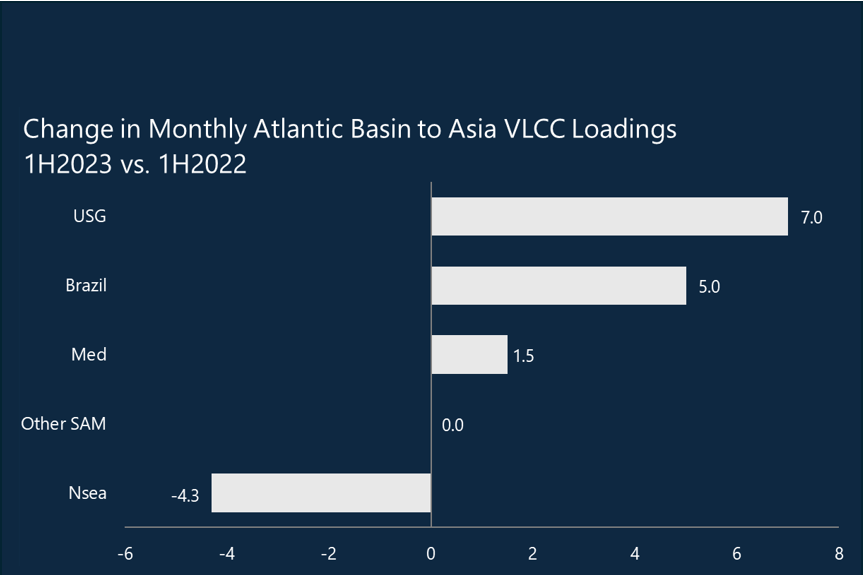
Firstly, oil flows from Atlantic basin producers to Europe has increased. Crude flow data from KPLER clearly shows an increase this year, especially as we move into the second quarter. This of course is on the back of reduced crude flows into Europe from Russia. If we overlay this with Tankers International fixture data we note a sharp rise in VLCC liftings over the same period. In the second quarter of this year, we have counted an average of 13 inter-Atlantic VLCC liftings per month compared to historic figures of just 1-3 monthly liftings.

However, the increase in crude flows does not fully explain what has happened here, as this could have simply translated into a boom in the Suezmax and Aframax segments. This did occur to some extent. As Europe began to replace Russian crude with similar grades from suppliers in the Atlantic basin, freight rates for the smaller tankers spiked as demand went up. A relatively weak VLCC freight market meant that this segment became more competitive, even on these shorter routes, and VLCC fixing activity started to take off.

One question that arises is whether this represents a fundamental change to VLCC trade patterns going forward. The answer to this is not straightforward. If the crude flows into Europe from Atlantic basin suppliers remain at elevated levels, they will certainly provide a baseline for keeping a certain level of localised VLCC activity within the region. The swing factor is likely to be freight markets and the correlation between Suezmax and VLCC freight. Charterers will consider all options and, all other things being equal, choose the cheaper vessel.

Arabian Gulf VLCC volumes return to pre-pandemic levels

The global oil markets have entered 2022 with a sense of optimism. Where the new COVID-19 omicron variant momentarily threatened to stall any progress achieved through the summer and autumn months of last year, it appears to present less of a risk to market recovery than initially feared – and oil market reporting agencies continue to forecast demand recovery in 2022.

Many of these agencies are now predicting that demand levels will return to pre-COVID highs. The most recent indications from Platts Analytics point to an additional 4.6 million barrels per day of demand in 2022, hitting 103 million barrels per day, which is 0.4% above pre-pandemic levels.

Global oil supply is also rising strongly and, after a 1.6 million barrels per day increase in 2021, global supply growth is set to accelerate this year to 6.6 million barrels per day. While we see positive supply projections from places like the US, Canada and Norway, it is still thought that a strong call on OPEC will remain. This will push Saudi Arabian supply even higher than it currently is, according to Platts Analytics, and we could see volumes close to their official capacity levels of 11.5 million barrels per day.

Any growth in oil volumes traded is positive for the oil tanker sector, and historically there is a strong correlation between OPEC production and the demand for large crude carriers, in particular for VLCCs.

The VLCC market has already seen demand increase in the Middle East; towards the end of last year the number of spot market cargoes lifted in the Arabian Gulf reached a similar level to those experienced in 2019, before the COVID-19 pandemic.

In 4Q 2021 we counted an average of 157 VLCC spot cargoes lifted in the region per month. This trend looks set to continue into this year. In January we have also counted 157 VLCC liftings in the Arabian Gulf and on the Tankers International VLCC Fixture App we note that fixtures are surpassing the expected numbers for the month.

With oil production projected to ramp up through the course of 2022 we expect to see further expansions in tanker demand, not only in the Arabian Gulf but globally. Preliminary data (available via the Tankers International VLCC Fixture App) shows that the lifting programme in West Africa is also larger than expected in January and the same is the case for the US Gulf and South America region.

While the Arabian Gulf volumes are important to the VLCC market and a very good indicator of the general health of vessel demand, crude oil shipped from the Atlantic Basin tends to carry greater tonne miles, employ vessels for longer periods and ultimately reduce tonnage availability across the globe.

The VLCC market is moving towards an equilibrium where demand is closing in on supply, thereby reducing tonnage availability per cargo which should in turn translate into better freight rates.

Historically Low VLCC Orderbook Drives Market Optimism

The VLCC orderbook is at a historically low level, with the segment making up just 8% of the global trading fleet. This metric supports our positive freight market outlook for 2022. With many shipyards reporting limited availability in the next couple of years, it is unlikely that many new VLCC orders will be placed for delivery in 2022-2024. This means we have a good grasp of expected fleet additions for this time frame.

The VLCC orderbook is shrinking on the back of a slowdown in tanker contracting. This is driven by several factors. The oil tanker sector has gone through a period of very low earnings. Most VLCC owners have been far from breaking even on most of their vessels, making it difficult to justify investing in new tonnage. Secondly, the shortage of large vessel slots in reputable yards has pushed prices up. An earnings boom in the container and dry bulk sectors has encouraged contracting in these segments, filling up yard capacity fast. Another driving force is the uncertainty around the longevity of any engine design decisions made today and how to ensure newbuilt vessels will successfully navigate a low-carbon future.

With low fleet growth expected over the next few years the VLCC market is moving closer to an equilibrium between vessel supply and demand. Vessel demand has already started to see signs of a sustained recovery. The demand for oil is picking up across the world and OPEC and its allies are determined to maintain their original schedule of incremental monthly oil production increases.

As more oil is moved around the globe, the demand for oil tankers will benefit. We are optimistic about 2022 and believe that this is the year we will see a positive shift in the VLCC freight market.