The second quarter of 2026 will be remembered less for freight cycles than for the event that overshadowed them all: the effective closure of the Strait of Hormuz. The world’s most consequential oil chokepoint remained largely inaccessible to mainstream VLCC trade, forcing charterers, owners and traders to rebuild logistics around a rerouted market, one where Fujairah, the Gulf of Oman and the Red Sea emerged as the de facto arteries of Middle Eastern crude.
The Middle East conflict continued to shape freight markets throughout the quarter, with geopolitical developments heavily impacting commercial decisions. The announcement of a ceasefire briefly stoked optimism in April. We saw oil prices ease, equity markets rallied, and a wave of prompt Arabian Gulf cargoes appeared to enter the market. However, as the details of the ceasefire became clearer, much of that optimism faded. Hormuz remained effectively closed to normal VLCC transit, and any cargoes quoted for inside-AG loading failed to convert into actual fixtures. Owners, unwilling to commit vessels into restricted waters without clearer political guarantees, largely stayed on the sidelines.
In response, the Baltic Exchange introduced a new benchmark route tracking Mina al-Fahal to Ningbo cargoes (TD34). This formalised what the market had been reflecting for weeks, treating the Gulf of Oman as the new Middle Eastern baseline. The new route traded in closer alignment to Atlantic Basin pricing, carrying a lower geopolitical risk premium than the traditional AG benchmark.
Freight rates continued to reflect both underlying supply and demand fundamentals and rapidly shifting political headlines. Gulf of Oman benchmark rates held relatively steady through April and into May before softening as tonnage availability outweighed accessible cargo demand.
As peace talks gathered momentum again in June and sporadic reports suggested vessels were transiting Hormuz under specific conditions, owner sentiment briefly strengthened, and the market gained upward momentum. The most striking signal came from a handful of charterers bold enough to quote inside-AG cargoes loading from Zirku and Basrah with offers at extreme Worldscale rates being circulated, although no fixtures were concluded.
This pattern repeated itself throughout the quarter. Progress in negotiations with peace talks, supported rates, only for setbacks to quickly reverse sentiment. Continued uncertainty became the defining feature of the quarter, and any owner or charterer seeking a stable baseline to build positions around faced an almost impossible task.
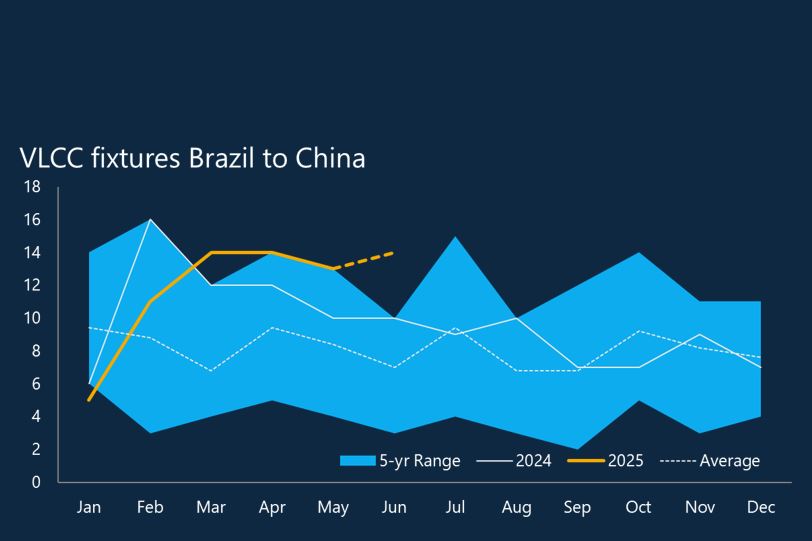
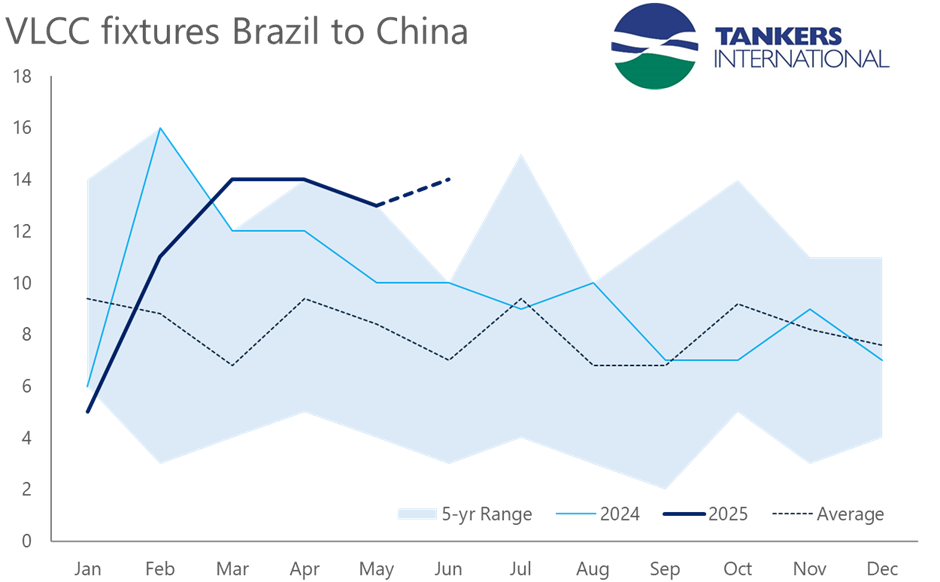
Against this backdrop of uncertainty in the Middle East, the Atlantic Basin gained strategic importance. Brazil was the key driver of activity during the quarter. Enquiry levels remained steady, while the number of ballasters gradually declined as many owners delayed repositioning vessels from the Middle East in anticipation of a Hormuz-related improvement that ultimately did not materialise. Rates remained relatively stable through April and May before strengthening in June.
By contrast, West Africa was largely quiet throughout the quarter. Charterers covered the limited activity that existed through COA programmes with minimal engagement in the spot market.
In the US Gulf, April was characterised by front-loaded fixing activity, as charterers had already secured much of their second-decade May requirements in March. This left the spot market quiet and rates under pressure. US Gulf to China freight levels fell from around $25 million at the quarter’s opening to $16 million by late April. The market stabilised in May, with steady tender activity supporting levels near $17 million. However, by June the Atlantic position list tightened considerably toward the end of the quarter, with very few ships available and owners increasingly confident, and freight climbed back above the $20 million mark, setting up what could prove to be a more constructive start to Q3.
The displacement of Middle Eastern export volumes has left a clear imprint on tonnemile and vessel demand data. With Arabian Gulf crude largely inaccessible and Eastern buyers pivoting toward Atlantic Basin supply, West-to-East VLCC tonnemiles increased by 9% above last year’s levels. Although fewer cargoes moved overall, longer voyage distances involved helped offset the demand impact for vessel owners. As a result, tonnemiles on a global scale have broadly tracked 2025 levels, except March, when markets were still absorbing the scale of disruption.
One structural development worth noting is the UAE confirming its departure from the OPEC alliance as of 1 May 2026. In the near term, with Hormuz effectively closed and the regional conflict ongoing, the practical impact on export volumes is limited. Over the longer term, however, the UAE will be better positioned to accelerate production and increase exports independently once conditions stabilise. This has the potential to be a significant shift in the region’s supply profile and, by extension, in VLCC tonnemile demand.
This quarter demonstrated the VLCC market’s ability to absorb significant disruption and continue functioning in extreme conditions. Workarounds kept crude moving partially out of the Middle East, and the Atlantic Basin demonstrated genuine resilience. When Hormuz reopens and exports normalise, the market could see a significant rush of cargoes as producers work to clear backlogs and restore supply chains. All eyes will be on how quickly oil exports ramp up and whether tanker availability can keep pace with returning demand.
The question that defined this quarter, however, remains the one that will define the next: when.