The year 2022 was from the outset seen by many as the year we would finally see the VLCC market recover. After two years marred by Covid restrictions and challenging oil demand, this year started with greater freedom of movement for people across the world and OPEC committing to continuous oil supply increases. As the summer draws to an end, we have a clearer picture of how these changes have directly impacted the VLCC market through the first half of this year.
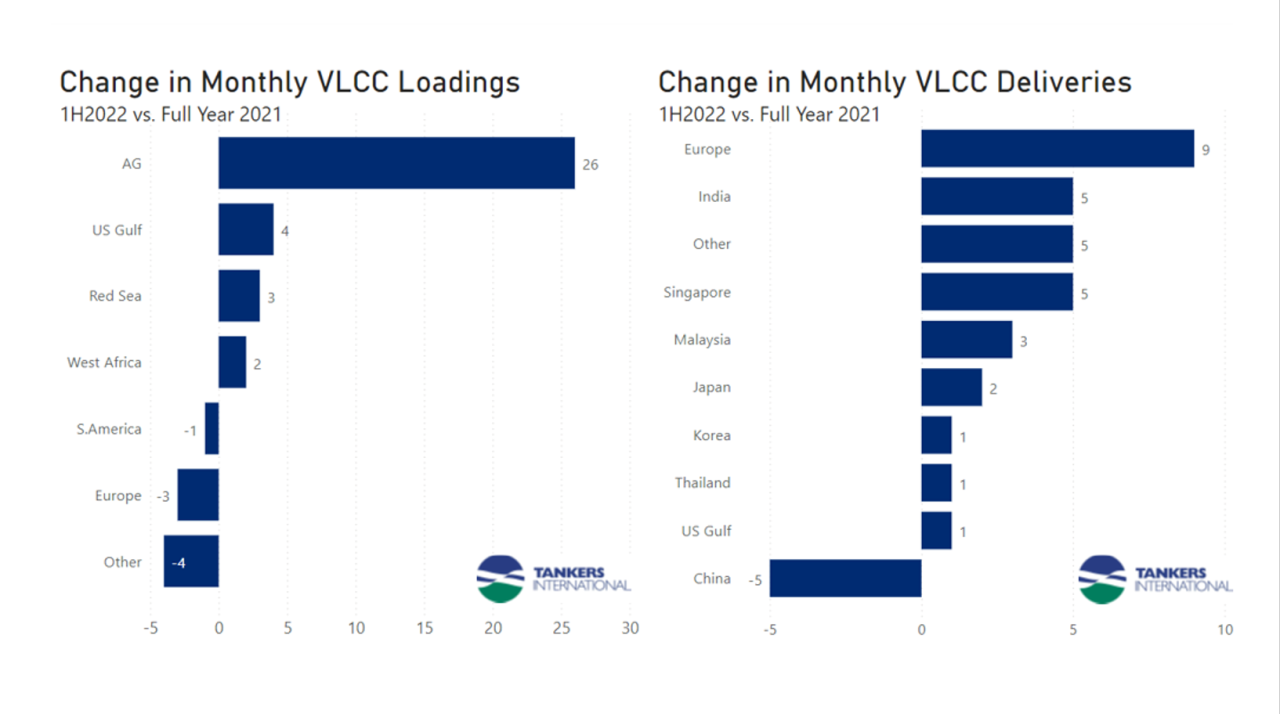
Looking at our proprietary data, we can compare the average monthly VLCC lifting numbers in the spot market for 2021 and the first half of this year. As oil demand and production have been rising throughout that period, we expect an increase in demand for VLCC tonnage and therefore, an increase in cargo counts in the segment. The data shows a definite boost. Globally we count an additional 27 monthly liftings in the VLCC spot market in the first half of this year compared to the 2021 annual average, and we are very close to reaching pre-Covid fixing volumes.
It is interesting to look at where these changes have occurred in more granularity. Unsurprisingly, the load area with the highest increase in volume has been the Arabian Gulf (AG). Many of the OPEC members that initially responded to the Covid-induced collapse in oil demand by cutting supplies are based in this region. This is also the region now returning oil supplies to the market at a steady pace. We count an additional 26 liftings per month from the Arabian Gulf alone this year. The data also shows a slight increase in volumes loading in the US Gulf with an additional four liftings per month. Much of this has been replacement barrels for Russian oil and has found a home in Europe, a route traditionally covered by smaller tanker segments when traded in lesser volumes. Simultaneously, we see a reduction in cargoes lifted from Europe over the period, as the region has kept supplies internal.
At the same time, Europe is topping the chart of increases in cargo volumes received into an area. This is off the back of a reduction in Russian oil taken following the country’s conflict with Ukraine. Traditionally Europe has not been a big receiver of crude oil in VLCC parcel sizes. However, this year has seen firstly a rise in oil imports into Europe and secondly a freight market that made the VLCC segment competitive relative to the suezmax freight market. We have also seen increased volumes into India, Singapore and other traditional receivers east of Suez. While China remains a significant taker of VLCC cargoes, the data shows an average of 5 cargoes per month fewer this year compared to 2021. This is down to them receiving more crude from Russia via pipeline and smaller tankers and due the country drawing down on inventories during a time of elevated oil prices.
It has been an interesting first half of 2022 in the VLCC market. Our previous blog discussed the change in crude flows into Europe, titled, “Atlantic crude flows drive change in VLCC tradelanes”, however, a positive takeaway from this piece, is that overall cargo counts are up, and not by an insignificant amount. 27 additional cargoes per month would employ more than 30 VLCCs full time if they were all traded between the AG and Singapore. Of course, some travel shorter distances and some travel further, but it is an indication that the market has seen the positive shift we expected at the start of the year, at least in terms of fundamentals. We need this to translate into a more dynamic freight market where tighter fundamentals dictate a sustained uplift in the freight market and a more profitable freight environment for shipowners.