What attracted you to Tankers International?
I’ve worked in the maritime sector for over 30 years, and I’ve experienced some dynamic moments during my time. I’ve been lucky to work for a range of different and unique companies from small shipowners focusing on Panamax vessels to large trading houses like Trafigura.
It was during my role at Trafigura that I started to specialise in demurrage – an indispensable and yet often overlooked element of shipping. When I left there, I was looking for a role that recognised the importance of demurrage and Tankers International was a great fit.
It was an exciting time to join Tankers International when I started in 2001 with lots of travel to introduce our team. Since then, we’ve had some impressive achievements, for example increasing the fleet to 70 plus vessels and outliving most other VLCC pools!
Overall, the team at Tankers International is positive about the claims and demurrage role and the present leadership team, led by CEO Charlie Grey is aware of the benefit of how my skills and expertise add to value to the pool, which is very motivating!
Can you shed more insight into demurrage claims in the tanker segment?
Demurrage is all about detail and requires a skilled eye regarding documentation – it’s much easier today as this documentation now comes via email as opposed to hard copies being sent off in the post. This means that certain elements of the claims processing have improved.
But challenges remain. There can be a lack of calculation standardisation between the Charterer and Owner, and we have to negotiate based on the information we have available which may not always be all the facts. As a result, it’s often the grey areas that require experience and a certain amount of trust to reach an agreement.
It is also important to note that charter parties rarely change, with some original contract wordings dating back to 1977 and due to this there are occasions when we find ourselves trying to interpret a term which may have had a different application when first drafted. Of course most Charterers use additional clauses to cover such discrepancies and other operational situations which may arise, but these are not always written in the clearest manner and therefore can also be problematic.
In my opinion having a dedicated person to handle this complexity is a must. Yet, in smaller companies, demurrage is often job-shared, with less priority placed on this important role, which risks missed revenue opportunities. We’re also seeing broader trends where demurrage teams are changing frequently, including new locations, which adds more challenges to claims settlement.
How does your role support Tankers International?
The claims and demurrage role will continue to evolve and remain vital. Over the years it has cemented its place as an integral part of shipping across all types of commodities. Whilst some commodities, such as coal, are less impacted by this source of income, the VLCC sector is more greatly affected.
Demurrage rates of VLCC fixtures can reach six figures, making this a valuable post-fixture revenue element. Under our contracts there is usually an allowance of five days to load and discharge the cargo meaning that with variables such as no room for the cargo, or waiting in the queue outside ports, demurrage is very often incurred.
As the world’s largest VLCC pool, we have the privilege of working with different Owners and Charterers on new routes and welcoming new vessels into our fleet. This requires new contracts to be finalised. Part of my role entails structuring the required laytime charter party clauses that this calls for.
How does Tankers International stand out in its approach to demurrage claims?
Tankers International is a progressive company and this is reflected in the way it handles demurrage. We have a bespoke system that works out the calculation for demurrage, but this is supplemented by the expertise of the Tankers International team, which balances the Owner and Charterers’ preferences.
We are transparent with regards to how we report demurrage collection information back to the pool partners, with biannual reporting on demurrage. If requested, we can also add value to our pool partners by advising them on demurrage claims based on our detailed database.
At Tankers International, we pride ourselves on negotiating with new counterparties and developing new relationships. Our business is always changing globally, and due to our size, we understand the importance of having a dedicated person handling demurrage.
What have been your personal highlights during your time at Tankers International?
I would have to say a recent panel discussion at the Oil Operations & Demurrage conference was a real highlight. I was part of a panel, sharing my views and knowledge on the topic of Ambiguous Clauses in Sales Contracts and Charter Parties. Most of my work is behind the scenes and getting out there to discuss this vital role with fellow professionals was a great experience – I look forward to speaking more on the subject to generate more awareness of the importance and value it can deliver.
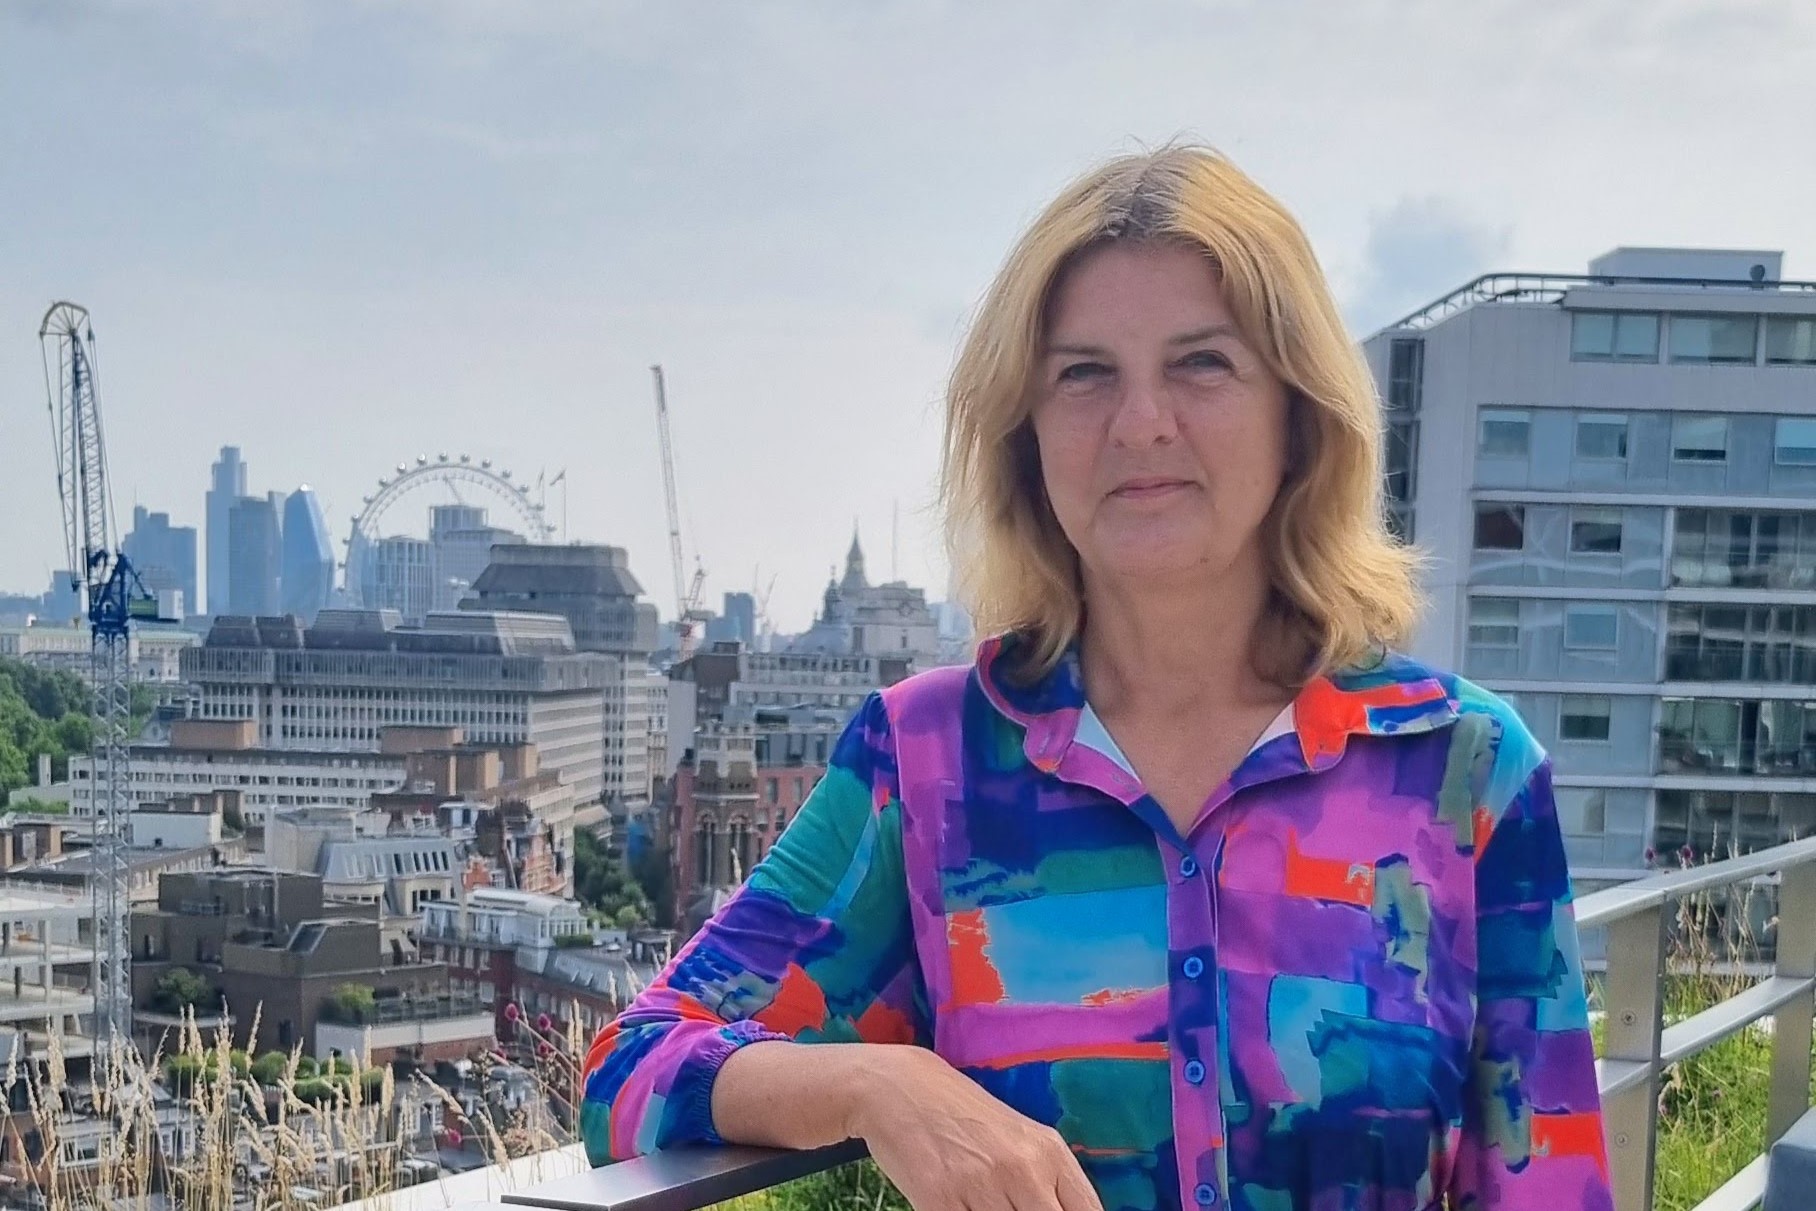
Toni Sharp, Claims and Demurrage Manager