Now that we have closed the books on 2022, we are looking back at a year of ups and downs. The year began with high expectations of a long-awaited VLCC market recovery, and although the recovery was slow to kick off in the VLCC space, the year ended on a high. 2022 also brought added complexity to VLCC trading strategies, as a result of changing trade patterns and new regulatory requirements around the Carbon Intensity Indicator reporting.
We used our detailed VLCC fixture database to digest last year’s events and analyse how they helped to reignite the freight market for the largest tanker segment.
Join us as we review our internal cargo count dashboard.

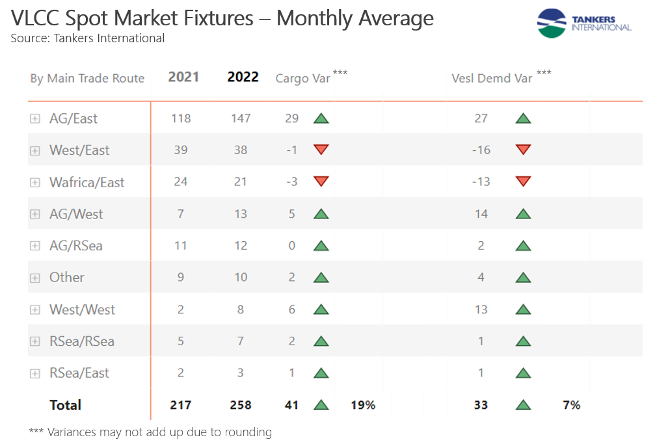
First, we need to look at absolute growth in VLCC cargo numbers. Counting cargoes fixed in the spot market, we noted an average increase of 41 liftings per month in 2022 compared to the previous year – this represents a growth level of 19%! To provide greater context, this compares to an annual growth rate of circa 4% across the last 10 years, before the pandemic impacted the market. We saw a huge drop in oil movements during 2020 as Covid restrictions kept global mobility and productivity at a minimum. While we experienced some recovery in 2021, it was not until 2022 that the world truly began practicing “living with Covid”, and the effects of this are now mirrored in oil demand and thus tanker markets. The year’s significant rise in VLCC cargo numbers resulted in a higher demand for VLCCs, as measured by days employed, which increased by 7%. This is in line with the 10-year average, excluding the two years impacted by Covid.
If we consider the various trade routes and how they have changed through the year, it becomes evident that significant growth was driven by the Arabian Gulf (AG) market. This load region saw an additional 35 monthly liftings across the year. This development runs parallel to the OPEC+ commitment to gradually add oil supply back to the market throughout the year. Following the announcement that the alliance would cease gradual additions, we noted a slight drop in cargo numbers from 186 monthly liftings in 3Q-2022 to 174 monthly liftings in the fourth quarter. This level of activity remains much higher than pre-Covid cargo counts of 160 in the fourth quarter of 2019, and it provides a solid baseline of activity for the VLCC market.
The second largest trade route in the VLCC market is West to East. This route encompasses all of the load regions in the Atlantic basin, excluding West Africa. Our fixture data indicates a monthly average of 38 liftings on this route – a slight decline from the previous year. This relatively low average, however, is marred by very low activity in the second quarter when we counted just 32 liftings per month. The driving force behind this was mainly at the receiving end, as China experienced a period of significantly reduced crude purchases.
Contrary to most other countries, China continued its zero-Covid policy through much of 2022 and lockdowns remained in place for longer than the rest of the world. China began to emerge from these restrictions over the summer months, and in combination with new product export quotas, the market saw renewed crude demand from Chinese refiners. This was the real catalyst for the buoyant VLCC market we have today. Not only did Chinese crude demand return, but China was sourcing much of the incremental barrels from the Atlantic basin. Tankers international recorded 46 liftings on the West to East trade lane each month in September, October and November.
The corresponding change in vessel demand on the West to East route indicates an overall decline. This is due to a more efficiently traded VLCC fleet, as more AG to West volumes emerged. VLCC owners were able to increasingly triangulate their trading between the AG, Europe and the Far East, reducing their overall ballast leg and, consequently the time that vessels are employed on the West to East route. The increase in vessel demand on the AG/West routes makes up for most of the decline on the West to East route.
Another game changer in 2022 was the resurgence of inter-Atlantic trading on VLCCs. On our dashboard these trades are listed as “West/West”. Europe has been pulling crude oil from new suppliers in the US, Brazil and West Africa, and on some of these routes, it became more economical to employ tankers from the largest segment. Since May, we count an average of 11 monthly liftings on these routes. The pull of VLCCs into Europe both from the Atlantic basin and the AG has given shipowners the ability to become more creative in the trading of their vessels, devising increasingly complex strategies to maximise the utilisation of their assets. This has been a welcome development!
Although the VLCC market was slower to recover than the Suezmax and Aframax markets and remained lacklustre through most of the first half, it has since returned with full force. It has been encouraging to see the market quickly adapting to added trading complexities and changing trade flows. We will continue to count cargoes and analyse any changes to trade flows through 2023. While we may not see the same uptick in absolute fixture numbers this year, tonne miles are set to continue on an upward trend with more oil moving long-haul. Given that development, we will see demand growth in the VLCC segment remain robust.


